Local LLM Speed by GPU Generation, and Our Production's Daily Token Volume
Model names, serving configs, and full prefill/decode measurements included (reorganized as of 2026-09-26)
In my last post(new tab) I talked about switching to the RTX 5090. This post picks up from there. I'm laying out exactly which model I run and how it's configured, the prefill/decode speeds per card, and how the model-adoption decision played out.
I first wrote this post on August 27, 2026 and have appended to it twice since. On September 8 I added measurements from the mixed-vendor setup that paired the 5090 with an R9700, and on September 26 I folded in the results of tuning the 27B dense on the 5090 alone and the 35B MoE on the R9700 alone, and rewrote the whole post as one continuous piece. Any sentence without an explicit date is as of September 26, 2026.
Judgments from the first version that later turned out to be wrong are left in place, not deleted. Things like converting bandwidth ratios into speed, or measuring speed by averaging per-call rates. I think where and how I went wrong is a more useful lesson than the numbers themselves.
The hardware I've gone through
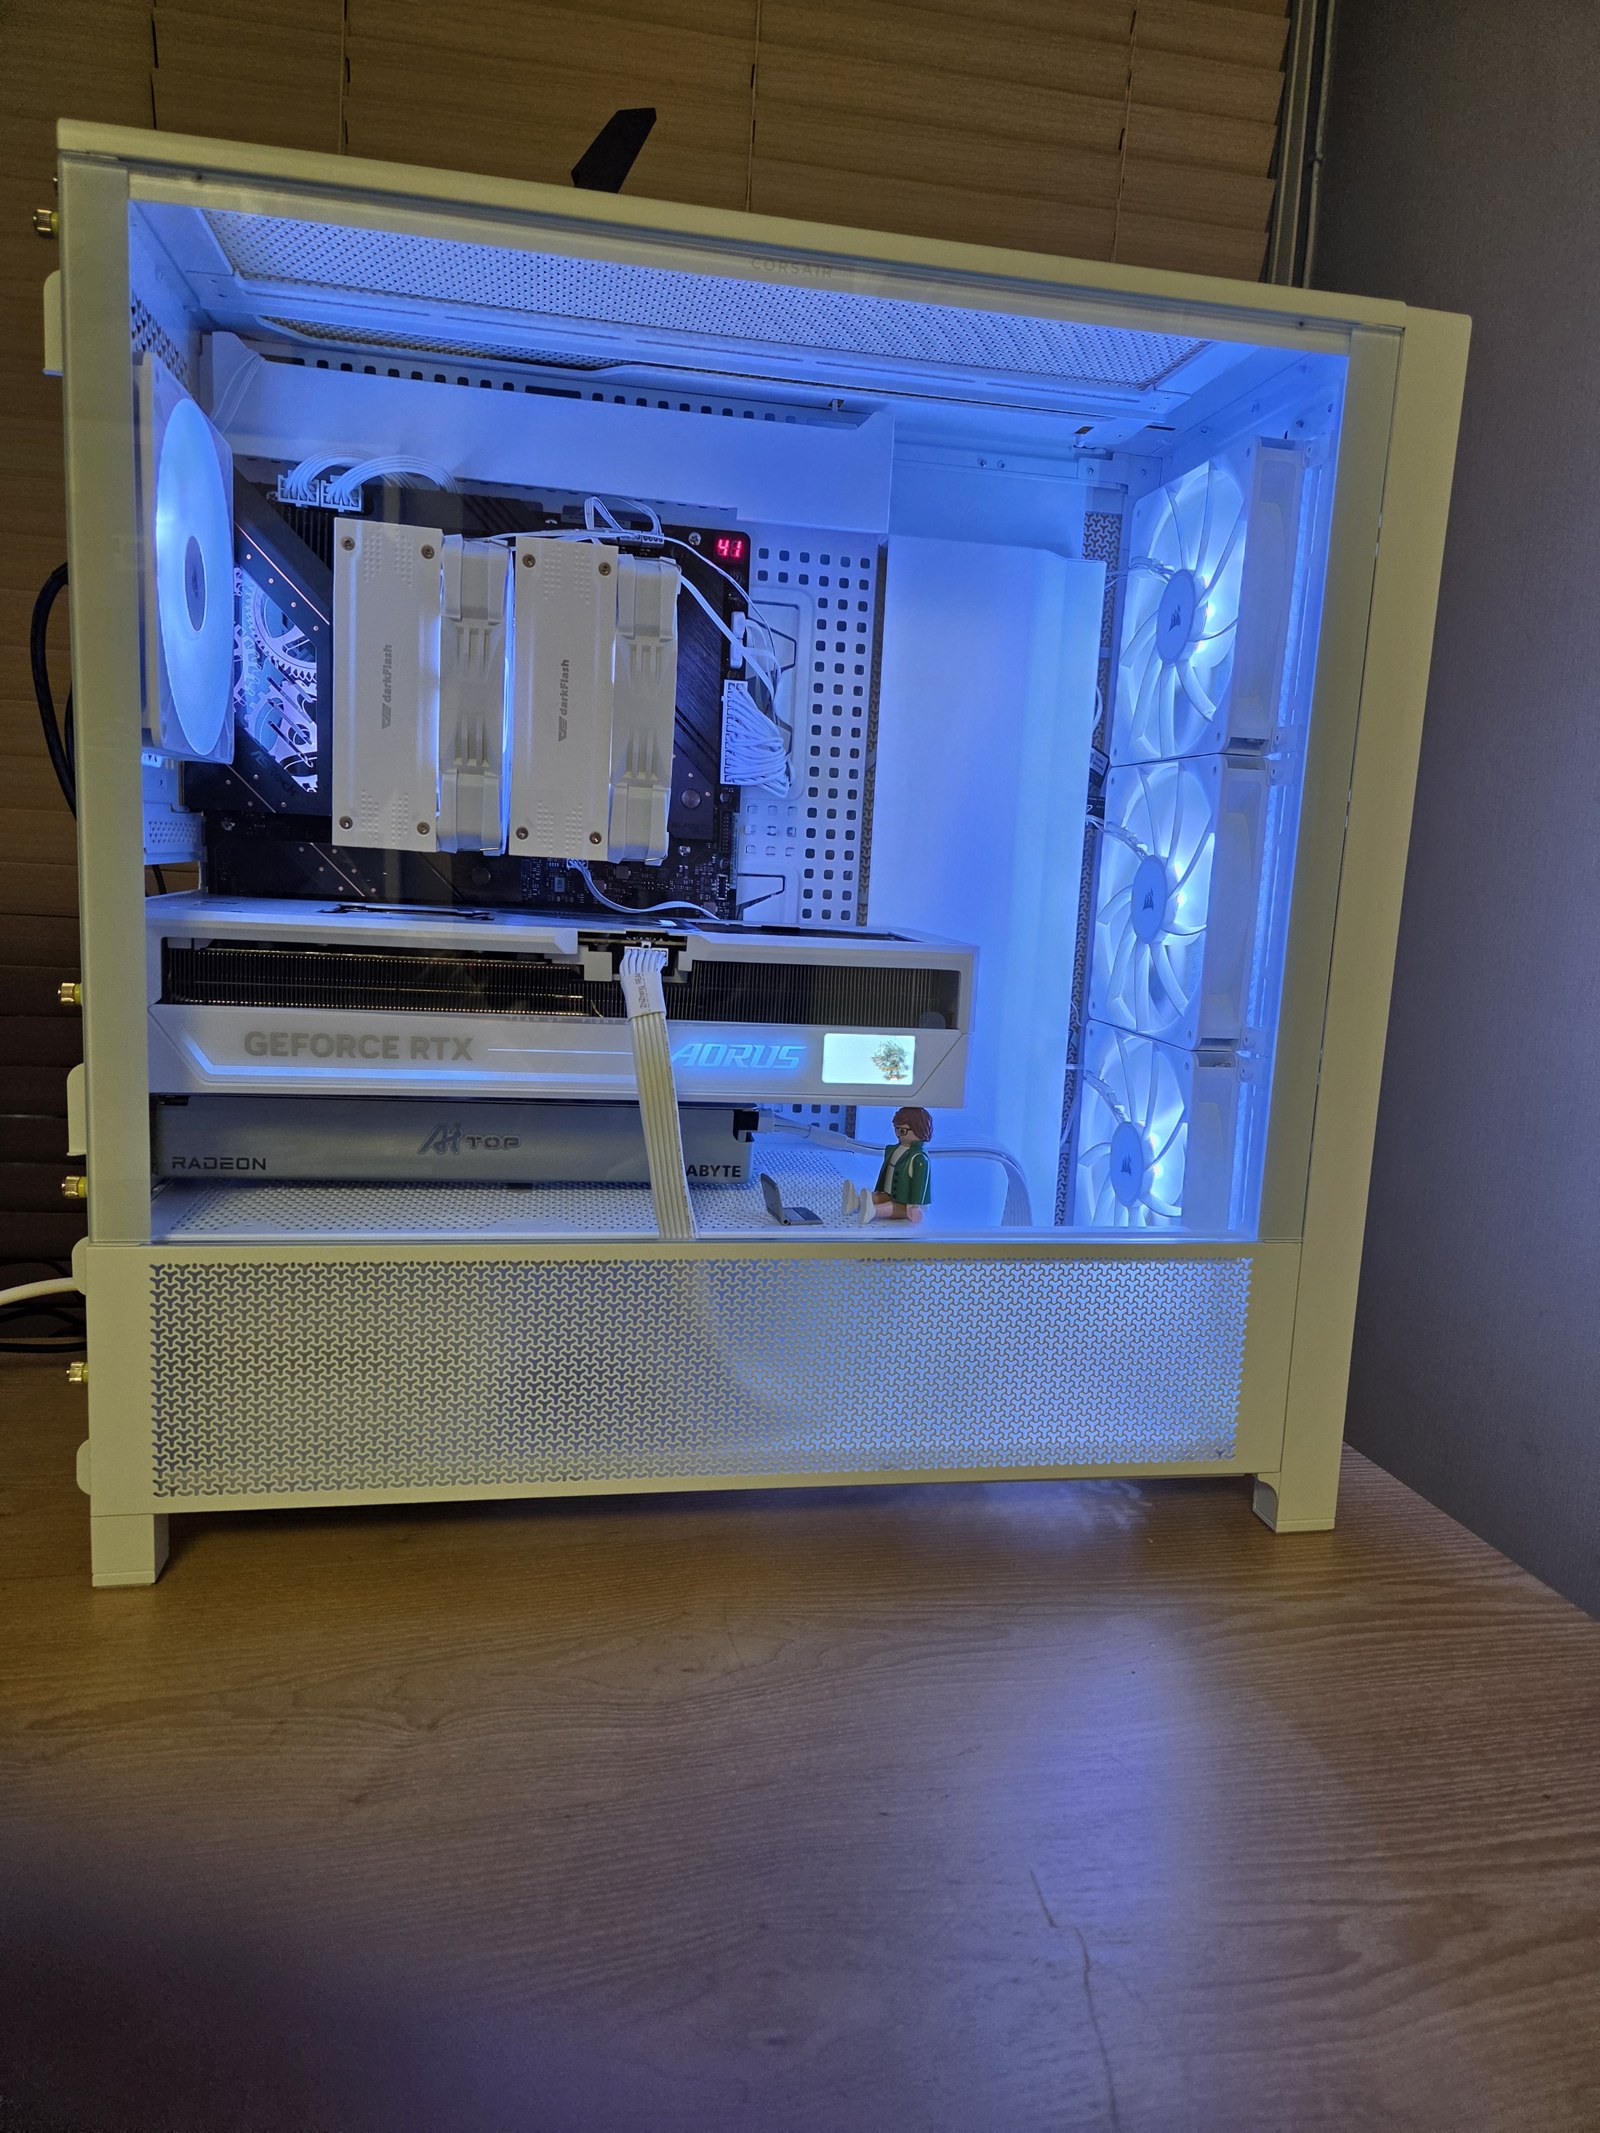
This bot's local LLM card has gone through one RTX 4070 Ti Super → two → one RX 7900 XTX → one RTX 5090 → 5090 + R9700 mixed vendor → 5090 alone (main) + R9700 alone (backup).
| Setup | VRAM | Model | Result |
|---|---|---|---|
| 4070 Ti Super ×1 | 16GB | The model back then | Didn't fit in memory at all |
| 4070 Ti Super ×2 (tensor-split) | 32GB | 35B MoE | Nightly 100-stock batch: 5.81 hours |
| RX 7900 XTX ×1 | 24GB | 35B MoE | Same batch: 6.15 hours (one card replaced two) |
| RTX 5090 ×1 (production Aug 27 to Sep 5) | 32GB | 27B dense | Nine production nights: about 226 s/stock (6.3h) |
RTX 5090 + AMD R9700 ×1 (mixed vendor, layer split -ts 23,25, production Sep 6 to 25) |
32GB+32GB (64GB) | Qwen3.8-Flash-Next | 100 stocks: 369.9 s/stock (10.28h) |
| RTX 5090 ×1 (main path since Sep 26) | 32GB | 27B dense, MTP + 8 slots | Replay experiment: 102.0 s/stock (2.83h) — tuning post(new tab) |
| AMD R9700 ×1 (backup path, tuned Sep 24) | 32GB | 35B MoE, Vulkan 4 slots | Replay experiment: 172 s/stock (4.79h) — tuning post(new tab) |
The last two rows are not production — they're replay experiments on frozen input. The main model was switched to the 27B dense on the 5090 (MTP + 8 slots) on September 26, but there is no record yet of a full nightly batch completing on that config.
I wrote up how I ended up actually buying the R9700 and putting it in (photos included) in a separate post(new tab) — it's actually a card I'd rejected as a main-card candidate multiple times before, bought again for a different purpose.
How speed is measured
ta_usage_tracker logs input/output tokens and elapsed time for every LLM call, per stock. I first averaged output_tokens ÷ elapsed_s per call. But vLLM batches multiple stock requests concurrently (continuous batching), so a single call's apparent speed swings with however many other requests happened to be in flight at that moment — that gave numbers that couldn't actually be used to compare hardware.
So instead of averaging per-call rates, I recomputed it as total output tokens produced during that run ÷ the run's actual wall-clock duration (first call to last call). That's what this post calls "aggregate throughput".
For the same reason I've tried not to put numbers on different scales in the same cell. Every value in the tables below is labeled with its scale. There are three: aggregate throughput (the sum across all concurrent requests), single stream (one request running alone), and log peak (the highest instantaneous value in the server log, not an average). As concurrency rises, aggregate throughput goes up but per-stream speed goes down, so dividing a single-stream figure by an aggregate one to say "N times" is not valid.
Seconds per stock also come in two kinds. One is throughput-based (wall-clock time ÷ number of stocks); the other is slot-latency-based (how long each slot took to finish one stock). The latter is the former times the number of concurrent slots, and during the R9700 tuning I nearly put 188.5 s and 504 s side by side and concluded "the new build regressed". Every seconds-per-stock figure in this post is throughput-based.
The same trap has a mirror image. Throughput-based seconds per stock already reflect concurrency, and a review caught me about to divide by the slot count once more. Dividing twice overestimates speed by several times.
Finally, wall-clock time is confounded by output length. Back in the XTX days one run was overestimated by more than 3 hours simply because its outputs ran long. Since then I look at prefill/decode throughput alongside wall-clock, never wall-clock alone.
Measurements — 27B dense, by card
Same 27B dense model (Qwen3.8-27B), roughly 12.7k prefill tokens per call, limited to cards I've actually run myself. The XTX is under llama.cpp, the 5090 under vLLM.
| Setup | decode (scale) | 100-stock equivalent | Note |
|---|---|---|---|
| RX 7900 XTX, llama.cpp Q4_K_M, MTP on | 62.5 t/s (single stream) | 21.7h | prefill 768 t/s. Without MTP it was around 30 hours |
| RTX 5090, vLLM NVFP4, 3 slots — first full pass, Aug 27 | 118 t/s (aggregate throughput) | 6h 18m (227 s/stock) | One complete 100-stock pass used for the August 27 ranking — see the head-to-head section below |
| Same config — nine production nights (Aug 27 to Sep 5) | — | about 6.3h (about 226 s/stock) | Nine-night average |
| RTX 5090, vLLM NVFP4, 3 slots, MTP off — replay baseline (Sep 23) | 126 t/s (aggregate, ~42 per stream) | 5.68h (204.5 s/stock) | 100 stocks replayed on frozen input |
| RTX 5090, 14 slots (Sep 23) | 233 t/s (aggregate, ~27 per stream) | 3.22h (115.8 s/stock) | 28 stocks. Configured 14, but realized concurrency was 6-9 — the KV cache is the limit |
| RTX 5090, MTP + 8 slots (Sep 24) | 437 t/s (aggregate, log peak) | 2.83h (102.0 s/stock) | 24 stocks, one repetition. MTP, slots, and memory utilization changed together, so MTP's own contribution can't be isolated |
227 s and 226 s are values from different conditions. 227 s is the single first full pass on August 27 (6h 18m); 226 s is the production average over nine nights on the same config.
The XTX single-stream figure and the 5090 aggregate figure are measured differently, so a straight "N times faster" division isn't quite fair, but looking at the 100-stock runtime alone, it dropped from 21.7 hours on the XTX to about 6.3 hours on the 5090. The further drop from 204.5 s → 115.8 s → 102.0 s on the same 5090 through tuning alone is covered in the 27B tuning post(new tab). That said, pitting MoE against dense directly on the same 5090 tells a different story, covered below.
Measurements — 35B MoE and Flash-Next
The models in this table are MoE-family, not the 27B dense. Don't compare it directly against the table above.
| Setup | decode (scale) | 100-stock equivalent | Note |
|---|---|---|---|
| 4070 Ti Super ×2, 35B MoE (33-day avg) | 62.4 t/s (aggregate throughput) | 5.81h | Normal full nightly batch |
| RX 7900 XTX, 35B MoE (10-day avg) | 71.6 t/s (aggregate throughput) | 6.15h | Normal full nightly batch |
RTX 5090, 35B MoE, vLLM max-num-seqs 14 (Aug 26) |
911 t/s (aggregate throughput) | 46 min | First complete 100-stock pass — see the head-to-head section below |
| AMD R9700, 35B MoE, llama.cpp Vulkan 4 slots (Sep 24) | 185 t/s (benchmark harness, summed across 4 slots, ~46 per stream) | 4.79h (172.4 s/stock) | 12-stock replay. prefill ~2,650-3,000 t/s |
| RTX 5090 + AMD R9700 mixed, Qwen3.8-Flash-Next Q3_K_XL (Sep 7 to 8) | ~124 t/s (summed across 4 slots, ~31 per slot) | 10.28h (369.9 s/stock) | First complete 100-stock production pass. prefill ~610 t/s |
The Flash-Next row is a case where adding a second card actually made the per-stock time longer. That's not a hardware regression — the model changed. Flash-Next is faster than this post's 27B dense, but heavier (6B active) than the 35B MoE (3B active, 46-minute completion). The full story — three quantization swaps and a full day of concurrency/batch-size tuning on this mixed-GPU setup — is written up in a separate post(new tab).
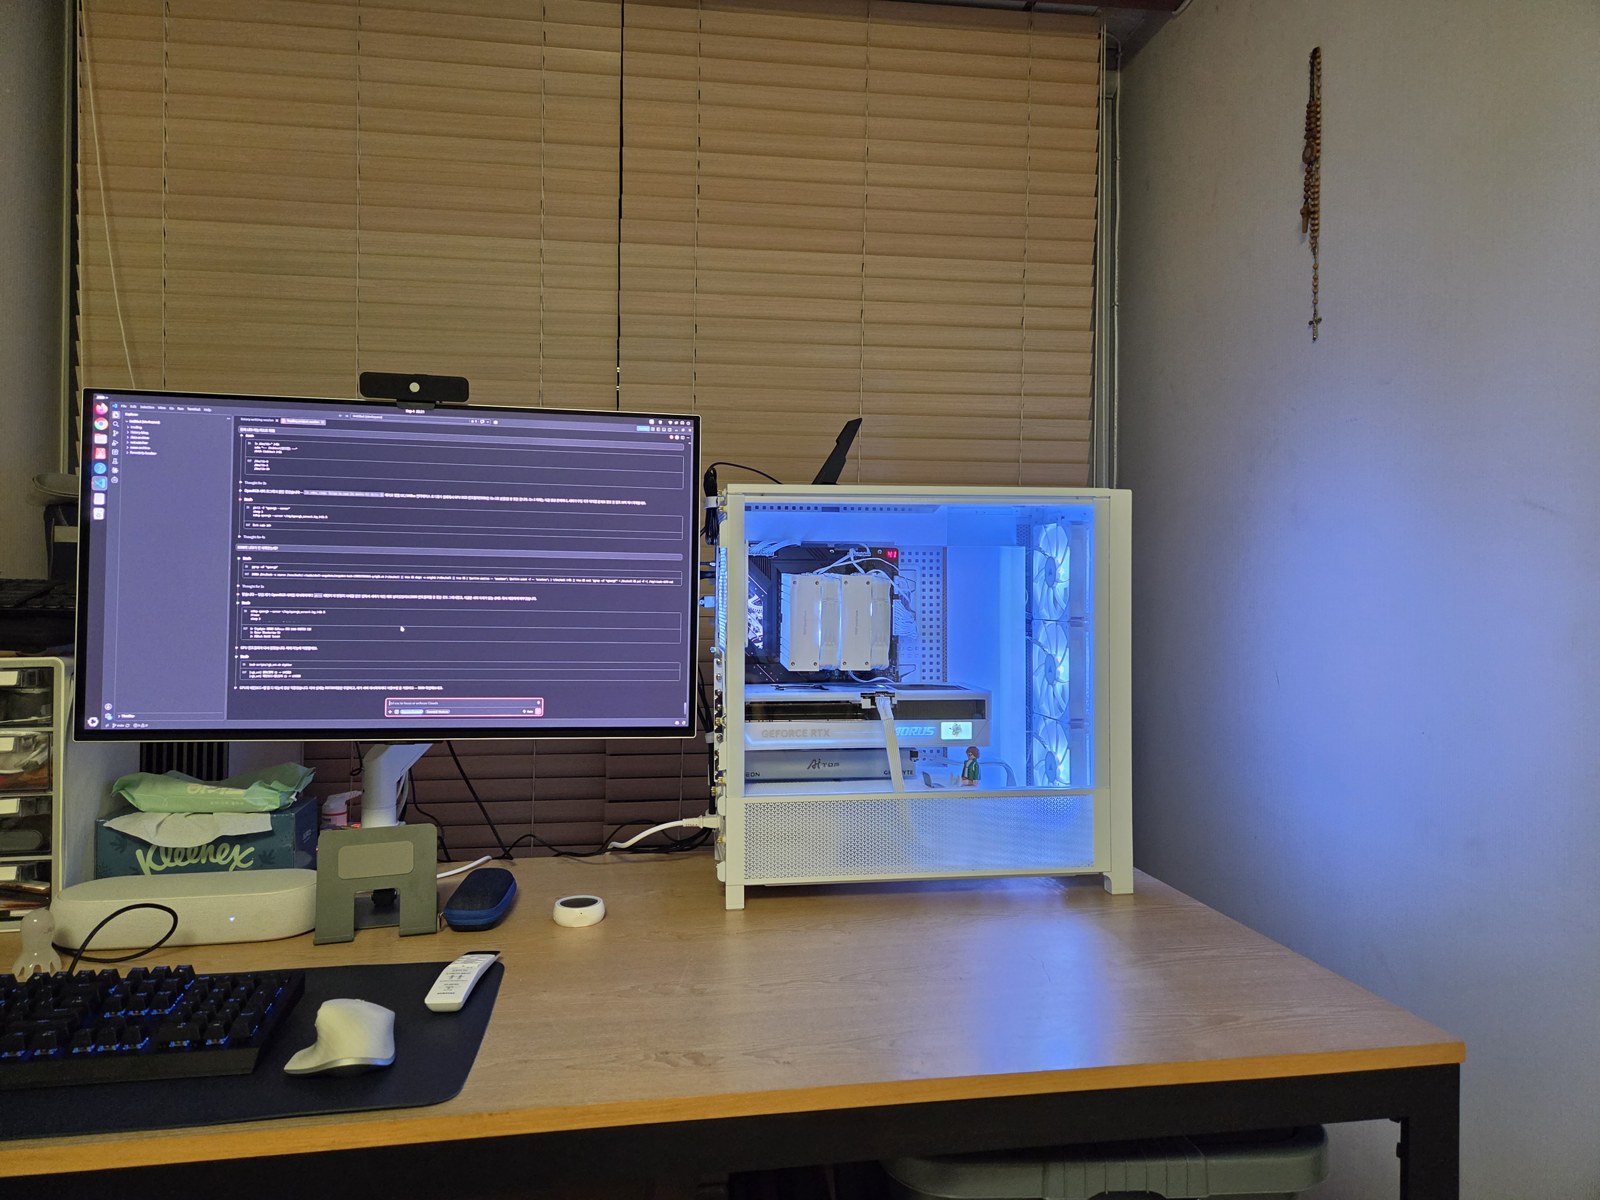
The R9700 row is not mixed serving — it's a backup path running the 35B MoE on this one card by itself. In the first sweep (September 4) I wrote that 3 slots was the best, then corrected it to 4 once I had a completed 4-slot run. That process is in the 35B MoE tuning post(new tab).
Raw decode speed by card — public cross-GPU benchmark
Decode speed by card for the same 27B-dense-class model with MTP on (source: arca.live cross-GPU thread(new tab); context depth uncontrolled, reference only):
| Card | decode (t/s) |
|---|---|
| RTX 3090 | 40-45 |
| AMD R9700 | 56 |
| RTX PRO 6000 Max-Q | 70 |
| RX 7900 XTX | 71 |
| RTX 5090 | 80 |
The 5090 is about 1.13x faster than the XTX. When I first wrote this post on August 27, I expected the 5090 to be much faster based on the memory-bandwidth ratio (1.81x), but it turned out that conversion doesn't hold once MTP is on — speculative decoding frees decode from the bandwidth ceiling.
The R9700 row above (56 t/s) was someone else's measurement on a 27B-dense-class model. When I actually bought the card on September 4 and measured it myself — not the same conditions, but the 35B MoE model, MTP on, single stream — I got 130-140 t/s decode, and a single stream on the latest build with MTP off gave 108 t/s. Not directly comparable to the table since the model differs, but it was evidence the card itself isn't slow.
MoE vs dense head-to-head on the 5090
On the evening of August 26 and the early morning of August 27, I ran MoE and dense side by side on the same 5090, and the August 27 ranking used the dense results. Here's what it actually took each model to complete one full pass over 100 stocks (each model's first complete pass):
| Model | Stocks | Run time | Input tokens | Output tokens | Wall-clock duration | Aggregate throughput |
|---|---|---|---|---|---|---|
| MoE (production at the time) | 100 | Aug 26, 20:41-21:27 | 18,315,222 | 2,497,437 | 46 min | 911 t/s |
| 27B dense (candidate used for the Aug 27 ranking) | 100 | Aug 27, 00:13-06:31 | 18,982,363 | 2,680,713 | 6h 18m | 118 t/s |
Same 5090, same 100 stocks — MoE is about 7.7x faster than dense. Dense being slower isn't a hardware issue — it's inherent to the model architecture (MoE only computes its active parameters; dense computes all of them every time).
Serving config and MTP
The serving config has changed by era as follows.
As of August 27. The model running every night was Qwen3.6-35B-A3B (MoE, 3B active), GGUF Q4_K_M quantization. Weights are 20.75GiB + 1.16GiB of KV/compute buffer = 21.91GiB in actual use (91% of the XTX's 24GB). The vLLM server ran on port 8200 with max-num-seqs 14, fp8 KV cache, prefix caching off, temperature 0.8, thinking mode off, frozen. At the same time I was evaluating Qwen3.8-27B (dense) under the same conditions (fp8 KV cache, prefix caching off, temp 0.8, thinking off) with only max-num-seqs dropped to 3 — dense has different memory/compute characteristics than MoE, so concurrency had to be lower for stability.
August 28 to September 5. The 27B dense was adopted and ran for nine nights on a single 5090 under vLLM. Quantization was an NVFP4 checkpoint, KV cache fp8, 3 concurrent slots.
September 6 to 25. The serving stack switched to llama.cpp, with the 5090 and R9700 joined in a single llama.cpp server (-sm layer -ts 23,25 -np 4 -b 512 -c 131072) running Qwen3.8-Flash-Next (Q3_K_XL).
As of September 26. The main path is the 27B dense on a single 5090 under vLLM (NVFP4, fp8 KV, max-num-seqs 8, 2 MTP speculative tokens, 0.95 GPU memory). The backup path is the 35B MoE on the R9700 under llama.cpp Vulkan (Q4_K_M, 4 concurrent slots, MTP off). The serving stack is back on vLLM.
The August 27 version of this post said MTP (speculative decoding) was "always on". That's no longer the case. The 27B dense on the 5090 under vLLM had MTP off for both the nine production nights and the replay baseline, and the September 24 replay experiment was the first time MTP was turned on for this combination. The R9700 backup path keeps MTP off for the reason below.
MTP acceptance rates vary a lot by model and settings. As of August 27 the known values were 50.1% for our 35B MoE, 66.95% for the 27B dense in an external measurement, and 81-97% in other external measurements. Values I've since measured myself: on vLLM, the 27B dense on the 5090 had 65-79% acceptance depending on the window, with 2 speculative tokens. The 35B MoE on the R9700, by contrast, sat around 50% regardless of backend or concurrency, and MTP actually hurt at two or more concurrent slots (1.58x slower at 3 slots). So the R9700 backup path runs with MTP off and 4 slots.
How the model-adoption decision played out
As of August 27, which of dense and MoE would be formally adopted wasn't decided. Running that day's ranking with dense for comparison didn't mean it was formally adopted. One of the ongoing verification methods was self-QWK: running the same stock set multiple times and measuring how consistent the resulting grades are (quadratic weighted kappa). For MoE, I had three repeated runs on the same 99 stocks (the MoE run in the head-to-head above is one of these three):
| Pair | QWK | Raw agreement |
|---|---|---|
| rep1 vs rep2 | 0.0853 | 59/99 |
| rep1 vs rep3 | 0.1260 | 56/99 |
| rep2 vs rep3 | 0.1481 | 61/99 |
| Average | 0.1198 |
The self-QWK band observed historically on the XTX was 0.08-0.21, so this value (0.1198) falls within it. The grade distribution skews toward "Hold" (71-80%), and QWK mechanically comes out lower when one grade dominates, so the raw agreement rate (56-61%) needs to be read alongside it.
Self-QWK for dense hadn't been measured as of August 27 (it was planned for that weekend), and this post doesn't include that result. The metric that actually decides adoption isn't self-QWK — it's forward RankIC (the correlation between predicted and actual return ranking), and there are still zero measurements of that. In other words, there's only a qualitative expectation that dense will perform better; whether it actually does is still unverified.
Here's how it went. The 27B dense was adopted on August 28, switched to Flash-Next on September 6, and switched again on September 26 to the 27B dense re-tuned for speed (MTP + 8 slots). Forward RankIC for this combination is still zero measurements.
Daily token volume
This project has an AI pipeline that analyzes stocks with a local LLM(new tab).
Normal weekday average (MoE only, no side-by-side comparison running): about 5,200 calls, roughly 55 million input tokens, roughly 7.5 million output tokens.
Same single 100-stock pass as the head-to-head above:
| Model | Stocks covered | Calls/stock | Input tokens | Output tokens |
|---|---|---|---|---|
| MoE (production at the time) | 100 | 17 | 18,315,222 | 2,497,437 |
| 27B dense (candidate used for the Aug 27 ranking) | 100 | 17 | 18,982,363 | 2,680,713 |
Both models used the same call depth here (17 per stock), so the token volume itself is nearly identical — the difference shows up not in tokens, but in the wall-clock time above (46 min vs 6h 18m). For reference, on a normal day of MoE running solo (weekday average), calls per stock can run much higher (about 55-71), since call depth itself depends on the purpose of that particular run (a formal production batch vs. a comparison run like this one).
What's next, and what's still unverified
The first production night on the 5090's 27B dense (MTP + 8 slots) is scheduled for September 29. That's when I'll measure the real 100-stock time and see how far it lands from the replay experiment's 2.83 hours.
Starting September 28, the R9700 backup path will grade the same 100 stocks alongside the main path every night, accumulating forward RankIC for both paths. So far there are zero forward RankIC measurements for any combination, and being fast and being a trustworthy signal are separate questions. Once the verdict is in, I'll write it up as a separate post.